How to Measure Humidity in a Shed (and Find the Real Cause of Damp)
A customer called me last month sounding frustrated.
'John, my shed's always damp. I've put bubble wrap on the walls and added vents, but the tools are still rusting. Some days the roof drips, other days the walls feel wet. I can't tell if it's condensation or if water's coming in from outside.'
It's a question I hear a lot. Sometimes the culprit is inside - warm air hitting a cold metal roof. Other times it's outside - blocked gutters, a cracked felt joint, or a damp-proof course that's holding water under the floor.
The tricky part is that both problems look the same: damp patches, musty smell, wet tools. The only reliable way to tell one from the other is to measure what's happening inside the shed.
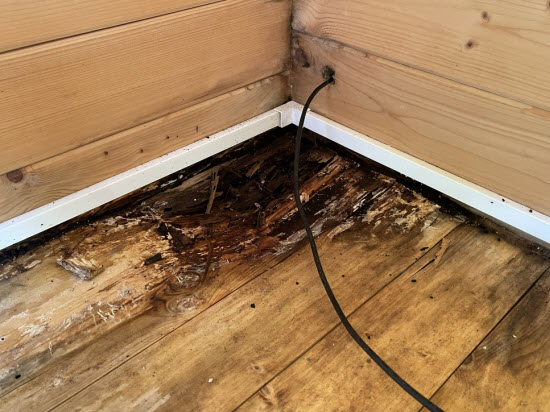 Damp in a shed can take many forms. In this case the decaying floor boards were hidden beneath laminate flooring. The source of the damp was a damp proof membrane
that retained water leaking in from above. Rather than protecting the building from damp from below!
Why Measuring Matters
You can't fix what you can't see
When people tell me their shed is damp, they usually list everything they've already tried.
- 'I've added vents.'
- 'I've insulated the roof.'
- 'I've painted the walls with waterproof sealer.'
And still, the condensation keeps coming back. The problem is that all those fixes are working in the dark. Without knowing when and why the moisture appears, you're only guessing. It's like trying to stop a leak in a hosepipe that's buried underground - you might dig in the right place eventually, but it takes a lot of wasted effort first.
A small temperature and humidity logger turns that guesswork into facts. It shows you when your shed air becomes saturated, how fast it happens, and whether it's linked to cold nights or rainy days.
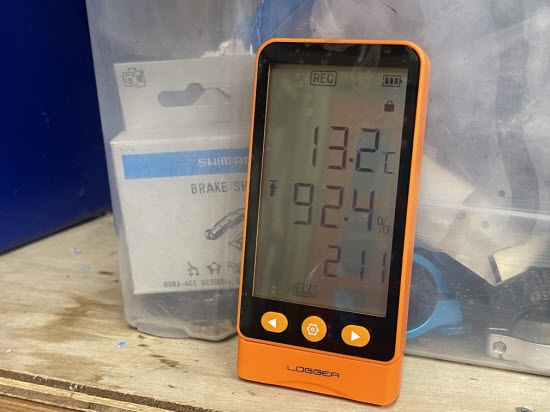 Our combined temperature and humidity logger measures the two factors for up to a year. The graphical output can identify typical profiles for different sources of damp
Condensation or water ingress? The data tells you
Moisture in sheds comes from two very different directions. Condensation happens when warm, moist air meets cold surfaces - the classic 'raining roof' effect. Water ingress, on the other hand, creeps in from outside: blocked gutters overflowing down the back wall, a cracked felt seam letting in drips, or a damp-proof course that's actually trapping water underneath the floor.
Both leave the same signs - wet patches, rusty tools, a musty smell - so it's easy to chase the wrong problem. But a humidity logger records patterns that reveal the truth. If the humidity spikes overnight as the temperature drops, it's condensation. If it climbs sharply during rain and stays high long after, you're looking at an external leak.
How the pattern helps you act
Once you see that pattern, the right solution becomes obvious. A night-time spike means you need better insulation or airflow. A rain-related rise means you should be checking your gutters or roof joints.
The logger doesn't just tell you the numbers - it tells you a story. It shows when the shed's environment turns against you, so you can make changes that actually matter.
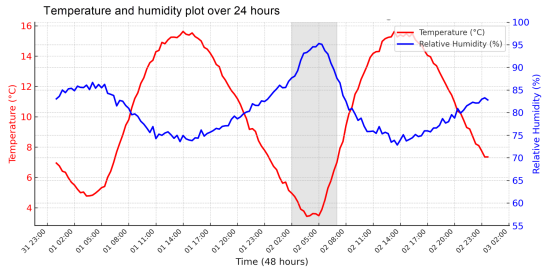 This graph shows how the temperature and relative humidity change over a 48 hour period
Understanding Humidity and Moisture Sources
What humidity actually means
Humidity sounds technical, but it's really just a measure of how much water vapour is floating around in the air. At 50 % RH, the air is holding half the water it could at that temperature. When it reaches 100 %, it can't hold any more - and the excess turns into droplets on cold surfaces.
Think of air like a sponge. When it's warm, it can soak up a lot of water. But as it cools down at night, the sponge shrinks. All the moisture it can't hold anymore drips out - onto the coldest surfaces first.
The dew point - where condensation starts
Every combination of temperature and humidity has a tipping point, called the dew point. If the air inside your shed drops below this temperature, moisture appears. For example, if your shed air is 15°C and 70 % RH, the dew point is about 9°C. Once the surfaces fall to 9°C or below, condensation forms. That's why metal roofs often 'rain' overnight - they cool faster than the air, crossing that dew-point line.
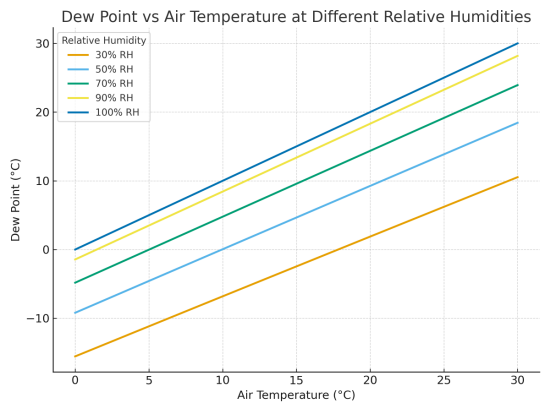 This dewpoint chart helps to identify when the building is at risk from condensation
Two paths for moisture: inside and out
Most shed owners assume condensation is the only problem. In reality, sheds fight moisture on two fronts:
Internal condensation - moist air trapped inside by insulation, bubble wrap, or closed doors.
External ingress - rain from blocked gutters, roof leaks, or damp courses holding water under the base.
From a distance, both look the same. But the logger shows the difference:
- night-time humidity spikes = condensation
- humidity climbing with rainfall = ingress
Seeing the difference with data
A few days' readings reveal which kind of problem you have. That's powerful knowledge: it stops you sealing a perfectly dry roof or cutting vents when the real issue is a blocked gutter.
How to Measure Humidity in a Shed
Why a quick reading isn't enough
A cheap digital hygrometer shows humidity now - but sheds change through the day. It might feel fine at noon yet be dripping at dawn. To understand what's really happening, you need continuous readings - that's what a data-logging humidity meter does.
What a data logger actually does
A logger records temperature and humidity automatically every few minutes. It builds a picture of how your shed behaves: when humidity rises, how fast temperature falls, and how both respond to weather outside.
We use a compact Shed Humidity & Temperature Logger, purpose-built for sheds and workshops: small, accurate, battery-powered, and easy to read on your computer afterwards.
How to set it up
Mount it about halfway up a wall, away from sunlight or metal.
Keep clear of doors and vents.
Add a second logger near a suspect wall or floor if you're testing for leaks.
Leave it running for a few days through varied weather.
When you download the data, you'll see two lines - temperature and humidity - that tell your shed's story hour by hour.
Where to Position the Logger
Placement makes all the difference
The goal is to measure what your shed actually feels like, not one odd corner. Avoid extremes and draughts; aim for calm, central air.
Avoid the obvious hot and cold spots
Don't mount directly on metal or glass - they distort readings. Stay clear of heaters or sunlit walls. Mid-height timber cladding gives a fair average.
Watch out for ventilation draughts
Near vents or doors, readings swing wildly. Pick a calm zone away from direct airflow so the sensor measures background conditions.
Testing for leaks or damp patches
Use a second logger near the suspect area. If that sensor stays wetter or dries slowly, you've found your culprit. A small open-ended plastic box keeps a near-floor sensor safe from splashes.
Two heights, one clear story
If you really want to understand how moisture behaves, use two loggers - one high, one low. In a metal shed, warm air near the roof can hold more moisture by day, but when the metal cools rapidly at night, it hits the dew point first - creating condensation. Air lower down stays steadier; if it stays humid while the top dries, you're seeing ground damp or water ingress. Two sensors reveal the full picture: condensation from above, damp from below.
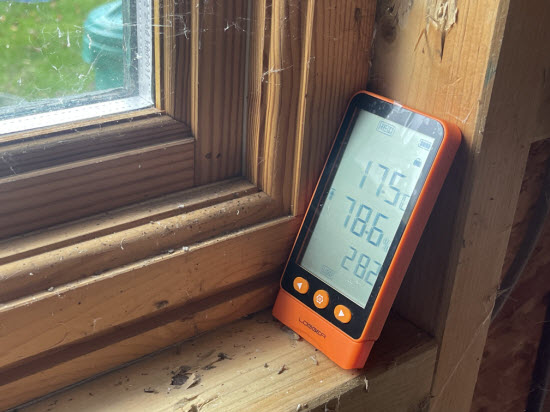 Incorrect placement. This is in direct sunlight and close to a window so will give exagerated and incorrect readings
Reading the Results - What Patterns Reveal
When the lines start to tell a story
Download a few days of data and you'll see two wavy lines. Temperature and humidity rise and fall together - your shed's heartbeat.
The classic condensation curve
Temperature drops after sunset; humidity climbs toward 100 %. That's condensation. By morning, the shed 'rains' inside. As sunlight warms it, humidity falls again. The graph looks like a mirror image - one line down, one up.
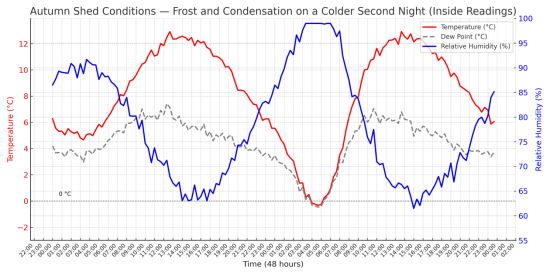 During normal conditions, humidity rises and falls with temperature. On the colder second night, the temperature drops enough for the air to reach its dew point, causing a
short-lived condensation spike that clears when the shed warms up.
The rain-related rise
If humidity jumps during rain while temperature stays flat, that's water ingress - a gutter overflow or tiny leak letting moisture in. The air isn't cooling; it's getting wetter.
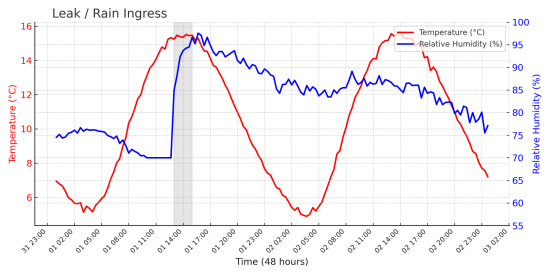 When rainwater leaks in, humidity ramps up rapidly and stays consistently high for days, even as the temperature follows its normal daily cycle - a clear sign that moisture
has entered the structure rather than forming from condensation alone
Ground dampness -the slow rise
If near-floor humidity stays high for days, even in dry weather, you're looking at trapped or rising damp from the base.
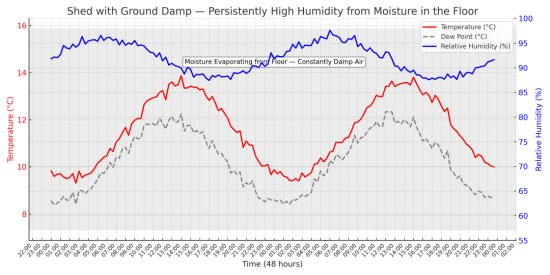 The temperature (red) and dew point (grey dashed) stay close together while the relative humidity (blue) remains high, showing a persistently damp atmosphere. This pattern is typical
of sheds built on damp or poorly ventilated bases where moisture continually evaporates from the floor.
Why this matters
Each pattern calls for a different fix:
- Condensation - insulate or ventilate.
- Ingress - clear gutters or repair roof.
- Ground damp - improve drainage or airflow.
Real-World Example - Two Sheds, Two Stories
The metal-roof shed that 'rained' inside
A customer in Crowborough had an 8x6 ft metal shed that dripped every winter morning. We logged it for a week: temp fell from 10°C to 3°C; RH rose 65 to 98 %. At 4 a.m. the dew-point line crossed - and condensation formed. After adding roof insulation and a vent, the peaks dropped to 80 %. No more drips.
The timber shed with mysterious damp patches
In Tunbridge Wells, humidity spiked during rain and stayed high afterwards. That ruled out condensation. A blocked gutter was overflowing down the back wall. Once cleared, readings returned to normal within two days.
What these stories prove
Same symptoms, different causes - and the logger told them apart. When you can see the pattern, the fix becomes obvious.
Testing Improvements - The Measure → Act → Measure Cycle
Turning your shed into a small experiment
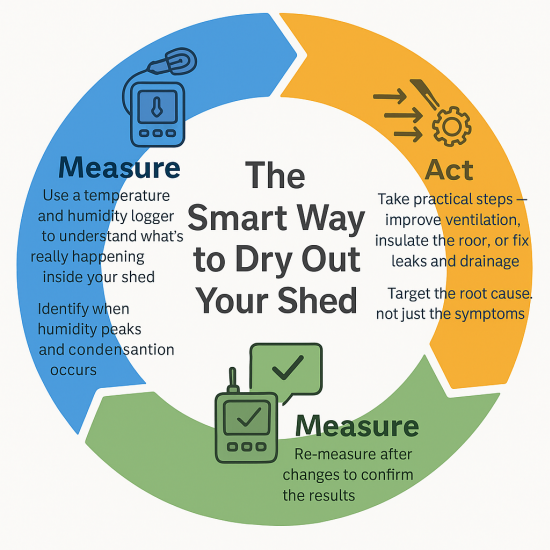
Measuring doesn't stop when you diagnose - it keeps helping you fine-tune. Follow a simple loop: Measure → Act → Measure again.
Step 1 - Measure your baseline
Record several days before doing anything. That's your 'before' picture.
Step 2 - Act: one change at a time
Add a vent, clear a gutter, insulate the roof - but only one step per test so you know what made the difference.
Step 3 - Measure again and compare
Overlay the new data on your baseline. Smaller humidity peaks = success. No change = next suspect. Progress you can see.
Soon you'll predict the graph before downloading it. You'll move from reacting to understanding.
Interpreting Your Numbers
What different Relative Humidites mean
- < 60 % Ideal Maintain airflow
- 60-70 % Watch zone Improve ventilation
- 70-85 % Caution Insulate or vent more
- > 90 % High risk Check for leaks or dripping roof
- 100 % Dew point Condensation active
You only need to know the comfort zones to read your data with confidence.
Temperature and humidity together tell the story
Temp ↓ + RH ↑ = Condensation.
Temp steady + RH ↑ = Leak.
Temp Steady + RH high = Ground damp.
Using dew point as your early warning
Watch how close temperature gets to the dew-point line - that's your signal to ventilate or add heat.
Make the data part of your routine
After a few weeks, checking the logger feels as natural as looking at the forecast - except it's your shed's forecast.
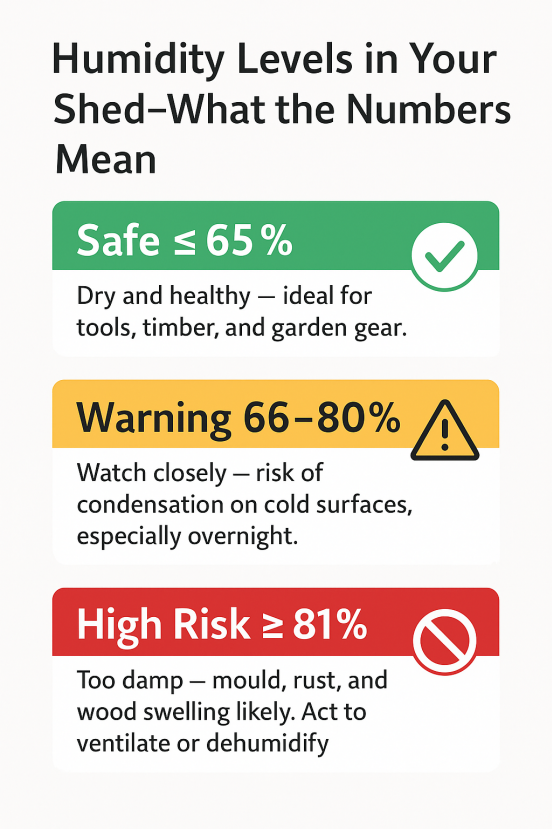 A simple traffic light chart to highlight when your shed may be at risk from condensation
Summary & Loop-Back - From Guessing to Knowing
Back to the first question
When that customer first asked, 'Is it condensation or a leak?', the logger gave the answer. Sharp night-time spikes meant condensation; steady rain-time rises meant a leak. Once fixed, the lines flattened and the shed stayed dry.
Knowledge is the real cure for damp
Without data, you're guessing. With it, you act with confidence - and every fix works the first time. It's the difference between mopping puddles and understanding the weather.
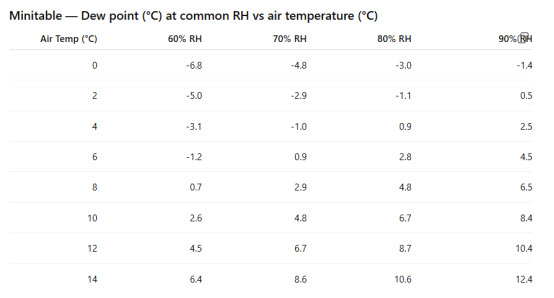 This dewpoint chart helps to identify when the building is at risk from condensation
Your shed, under control
A simple humidity and temperature logger turns every change you make into measurable progress. You'll know when your shed's healthy - and when it needs attention - long before the rust appears.
If you'd like to see what's really happening inside your own shed, use the Shed Humidity & Temperature Logger. Simple, accurate, and designed for small buildings.
Moisture Resources
- Shed Moisture Control – how humidity levels fit into the bigger picture
- Stop Shed Condensation – what to do once you've measured the problem
- Shed Dehumidifier vs Heater – interpreting your readings and choosing a solution
- Ventilating a Shed– using airflow to lower humidity
- Why Metal Roofs Sweat – when readings point to roof-surface cooling issues
- Is Bubble Wrap Insulation Making Your Shed Damp? Insulation & Condensation – what bubble wrap can tell you about your shed’s moisture load

Keep in touch with our monthly newsletter
Shed Building Monthly


